Local government elections in Warwickshire, England
Warwickshire County Council elections are held every four years. Warwickshire County Council is the upper-tier authority for the non-metropolitan county of Warwickshire in England. Since the last boundary changes in 2017, 57 councillors have been elected from 57 electoral divisions.[1]
Council elections
Summary of the council composition after each election; click on the year for full details of each election.[2]
| Year | Conservative | Labour | Liberal Democrats[a] | Green Party | Independent[b] | Control | Notes |
| | | | | |
| 1973 | 27 | 21 | 5 | | 2 | | No overall control | |
| 1977 | 43 | 10 | | | 2 | | Conservative | |
| 1981 | 30 | 27 | 3 | | 2 | | No overall control | New division boundaries[3] |
| 1985 | 26 | 24 | 10 | | 2 | | No overall control | |
| 1989 | 32 | 24 | 4 | | 2 | | Conservative | |
| 1993 | 19 | 30 | 10 | | 3 | | No overall control | |
| 1997 | 22 | 31 | 8 | | 1 | | No overall control | |
| 2001 | 20 | 28 | 13 | | 1 | | No overall control | |
| 2005 | 27 | 23 | 11 | | 1 | | No overall control | New division boundaries[4] |
| 2009 | 39 | 10 | 12 | | 1 | | Conservative | |
| 2013 | 26 | 22 | 9 | 2 | 3 | | No overall control | |
| 2017 | 36 | 10 | 7 | 2 | 2 | | Conservative | New division boundaries[1] |
| 2021 | 42 | 6 | 5 | 3 | 1 | | Conservative | |
| | | | | | | | |
Results maps
-
2005 results map
-
2009 results map
-
2013 results map
-
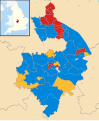
2017 results map
-
2021 results map
By-election results
1997–2001
Rugby Hillmorton By-Election 7 May 1998 | Party | Candidate | Votes | % | ±% |
| | Labour | | 1,011 | 43.1 | −6.9 |
| | Conservative | | 741 | 33.1 | +6.0 |
| | Liberal Democrats | | 489 | 21.8 | +0.9 |
| Majority | 270 | 10.0 | |
| Turnout | 2,241 | | |
| | Labour hold | Swing | | |
2005–2009
Wellesbourne By-Election 20 July 2006[5] | Party | Candidate | Votes | % | ±% |
| | Conservative | Laura Main | 1,112 | 52.6 | +3.0 |
| | Liberal Democrats | David Johnston | 776 | 36.7 | −6.0 |
| | Labour | John Ritchie | 227 | 10.7 | +10.7 |
| Majority | 336 | 15.9 | |
| Turnout | 2,115 | 35.6 | |
| | Conservative hold | Swing | | |
Lawford and New Bilton By-Election 6 March 2008[6] | Party | Candidate | Votes | % | ±% |
| | Labour | Douglas Hodkinson | 724 | 33.8 | −7.9 |
| | Conservative | Jane Watson | 723 | 33.7 | +4.7 |
| | BNP | George Jones | 313 | 14.6 | +14.6 |
| | Liberal Democrats | Diane Pask | 235 | 11.0 | −3.3 |
| | Green | Philip Godden | 148 | 6.9 | +6.9 |
| Majority | 1 | 0.1 | |
| Turnout | 2,143 | 28.9 | |
| | Labour hold | Swing | | |
2009–2013
Arbury and Stockingford By-Election 16 July 2009[7] | Party | Candidate | Votes | % | ±% |
| | Labour | Barry Longden | 1,331 | 41.7 | +13.5 |
| | Conservative | Tom Wilson | 1,079 | 33.8 | +2.6 |
| | BNP | Martyn Findley | 449 | 14.1 | −10.4 |
| | Green | Michael Wright | 170 | 5.3 | −10.8 |
| | Liberal Democrats | Alice Field | 118 | 3.7 | +3.7 |
| | Socialist Alternative | Steven Gee | 43 | 1.3 | +1.3 |
| Majority | 252 | 7.9 | |
| Turnout | 3,190 | 21.4 | |
| | Labour gain from Conservative | Swing | | |
Nuneaton St Nicholas By-Election 6 May 2010[8] | Party | Candidate | Votes | % | ±% |
| | Conservative | Jeffrey Clarke | 3,195 | 56.3 | −8.5 |
| | Labour | Paul Hickling | 1,616 | 28.5 | +9.0 |
| | Green | Keith Kondakor | 589 | 10.4 | −5.4 |
| | Independent | Thomas Wilson | 280 | 4.9 | +4.9 |
| Majority | 1,579 | 27.8 | |
| Turnout | 5,680 | | |
| | Conservative hold | Swing | | |
Studley By-Election 6 May 2010[8] | Party | Candidate | Votes | % | ±% |
| | Liberal Democrats | Clive Rickhards | 1,906 | 44.6 | −1.2 |
| | Conservative | Justin Kerridge | 1,755 | 41.1 | −1.5 |
| | Labour | Jacqueline Abbott | 480 | 11.2 | +6.4 |
| | Green | Karen Varga | 128 | 3.0 | −3.7 |
| Majority | 151 | 3.5 | |
| Turnout | 4,269 | 70.3 | |
| | Liberal Democrats hold | Swing | | |
2013-2017
Bedworth West by-election, 12 December 2013[9] | Party | Candidate | Votes | % | ±% |
| | Labour | Brian Hawkes | 904 | 62.56 | |
| | Conservative | Janet Batterbee | 353 | 24.42 | |
| | UKIP | Andrew Hutchings | 142 | 9.82 | |
| | TUSC | Natara Hunter | 46 | 3.18 | |
| Majority | 551 | 38.13 | |
| Turnout | 1,445 | 16.94 | |
Hartshill Ward by-election, 22 May 2014[10] | Party | Candidate | Votes | % | ±% |
| | Labour | Chris Clark | 738 | 32.9 | −2.0 |
| | UKIP | Bella Wayte | 699 | 31.2 | −2.3 |
| | Conservative | David Wright | 616 | 27.5 | −1.2 |
| | Independent | Carol Fox | 190 | 8.5 | +8.5 |
| Majority | 39 | 1.7 | |
| Turnout | 2,243 | | |
| | Labour hold | Swing | | |
Nuneaton Whitestone Ward by-election, 13 August 2015[11] | Party | Candidate | Votes | % | ±% |
| | Conservative | Jeff Morgan | 1,281 | 58.4 | +5.5 |
| | Labour | Andrew Crichton | 503 | 22.9 | −8.5 |
| | UKIP | Alwyn Waine | 292 | 13.3 | +13.3 |
| | Green | Mick Ludford | 119 | 5.4 | −10.3 |
| Majority | 778 | 35.4 | |
| Turnout | 2,195 | | |
| | Conservative hold | Swing | | |
2017-2021
Leamington Willes by-election, 3 May 2018[12] | Party | Candidate | Votes | % | ±% |
| | Labour | Helen Adkins | 1,164 | 44.7 | −1.2 |
| | Green | Martin Luckhurst | 1139 | 43.7 | +9.0 |
| | Conservative | Stacey Calder | 266 | 10.2 | −5.7 |
| | Liberal Democrats | George Begg | 36 | 1.4 | −2.1 |
| Majority | 25 | 1.0 | |
| Turnout | 2,605 | | |
| | Labour hold | Swing | | |
Stratford North by-election, 29 November 2018[13] | Party | Candidate | Votes | % | ±% |
| | Liberal Democrats | Dominic Skinner | 877 | 40.7 | +16.3 |
| | Conservative | Lynda Organ | 610 | 28.3 | −0.1 |
| | Stratford First Independent | Juliet Short | 345 | 16.0 | −17.1 |
| | Labour | Joshua Payne | 180 | 8.3 | −0.9 |
| | Green | John Riley | 144 | 6.7 | +1.5 |
| Majority | 267 | 12.4 | |
| Turnout | 2,156 | | |
| | Liberal Democrats gain from Stratford First Independent | Swing | | |
2021–2025
Arden by-election, 14 July 2022[14] | Party | Candidate | Votes | % | ±% |
| | Conservative | Ian Shenton | 1,609 | 59.3 | −14.7 |
| | Liberal Democrats | Thom Holmes | 854 | 31.5 | +24.3 |
| | Labour | Bryn Turner | 251 | 9.2 | −0.8 |
| Majority | 755 | 27.7 | |
| Turnout | 2,712 | | |
| | Conservative hold | Swing | | |
Dunsmore and Leam Valley by-election, 14 December 2023[15] | Party | Candidate | Votes | % | ±% |
| | Conservative | Dale Keeling | 911 | 42.8 | −23.0 |
| | Liberal Democrats | Stephen Pimm | 649 | 30.5 | +23.6 |
| | Labour | Alison Livesey | 350 | 16.4 | −2.5 |
| | Green | Helen Ford | 219 | 10.3 | +1.9 |
| Majority | 262 | 12.3 | |
| Turnout | 2,129 | | |
| | Conservative hold | Swing | | |
References
- ^ a b "The Warwickshire (Electoral Changes) Order 2015", legislation.gov.uk, The National Archives, SI 2015/1874, retrieved 7 September 2022
- ^ "Compositions calculator". The Elections Centre. Retrieved 10 August 2022.
- ^ The County of Warwickshire (Electoral Arrangements) Order 1981 (S.I. 1981/118)
- ^ "The County of Warwickshire (Electoral Changes) Order 2004", legislation.gov.uk, The National Archives, SI 2004/2820, retrieved 8 September 2022
- ^ "Electoral Division Wellesbourne". Warwickshire County Council. Retrieved 13 October 2009.
- ^ "Labour cling on to seat". Coventry Telegraph. 8 March 2008. p. 15.
- ^ Malyon, Mike (18 July 2009). "Constituents 'are cheated'". Coventry Telegraph. p. 2.
- ^ a b "Elections in Warwickshire – 6th May". Warwickshire County Council. Retrieved 15 May 2010.
- ^ Warwickshire County Council (11 August 2020). "Warwickshire news – Warwickshire County Council". News.warwickshire.gov.uk. Retrieved 17 June 2021.
- ^ "Local Elections Archive Project — Hartshill Division". www.andrewteale.me.uk. Retrieved 2 March 2024.
- ^ "Local Elections Archive Project — Nuneaton Whitestone Division". www.andrewteale.me.uk. Retrieved 2 March 2024.
- ^ "Local Elections Archive Project — Leamington Willes Division". www.andrewteale.me.uk. Retrieved 3 March 2024.
- ^ "Local Elections Archive Project — Stratford North Division". www.andrewteale.me.uk. Retrieved 3 March 2024.
- ^ "Local Elections Archive Project — Arden Division". www.andrewteale.me.uk. Retrieved 3 March 2024.
- ^ "Local Elections Archive Project — Dunsmore and Leam Valley Division". www.andrewteale.me.uk. Retrieved 3 March 2024.
- ^ Includes Liberal Party and Social Democratic Party pre-1988
- ^ Includes Residents' Associations
External links
- Warwickshire County Council
 2005 results map
 2009 results map
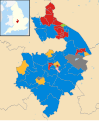 2013 results map
 2017 results map
 2021 results map


 Council elections in Warwickshire


