2016 local election in England
The 2016 Wirral Metropolitan Borough Council election took place on 5 May 2016 to elect members of Wirral Metropolitan Borough Council in England.[2] local elections .
After the election, the composition of the council was:
Party Seats ± Labour 39 1 Conservative 21 Liberal Democrats 5 Green 1 Independent 0
[3]
Election results Overall election result Overall result compared with 2015 .
Wirral Metropolitan Borough Council election result, 2016 Party Candidates Votes Stood Elected Gained Unseated Net % of total % No. Net % Labour 23 14 1 0 59.1 46.1 38,832 Conservative 23 7 0 0 31.8 30.8 25,956 Liberal Democrats 19 2 0 0 9.1 10.9 9,216 Green 21 0 0 0 0.0 6.8 5,703 UKIP 9 0 0 0 0.0 3.7 3,088 Independent 1 0 0 1 0.0 1.2 985 TUSC 7 0 0 0 0.0 0.5 394
[1] [2] [n 1]
Changes in council composition Prior to the election the composition of the council was:
↓ 38 21 5 1 1 Lab Con LD G I
After the election the composition of the council was:
Wirral Metropolitan Borough Council composition after the 2016 election Ward results Results compared directly with the previous local election in 2015 .
Bebington Bebington Party Candidate Votes % ±% Labour Christina Muspratt 2,505 57.0 Conservative Des Drury 952 21.7 UKIP Jim Bradshaw 516 11.8 Liberal Democrats Penelope Golby 233 5.3 Green Anthony Smith 187 4.3 Majority 1,553 35.4 Registered electors 11,919 Turnout 4,425 37.1 Rejected ballots 32 0.7 Labour hold Swing
[4] [5]
Bidston and St James Bidston and St James Party Candidate Votes % ±% Labour Julie McManus 1,702 70.6 UKIP Debbie Caplin 329 13.7 New Conservative Nick Hanna 190 7.9 Green Jayne Clough 107 4.4 Liberal Democrats Brian Gill 82 3.3 Trade_Unionist_and_Socialist_Coalition Benjamin Halligan 52 2.1 Majority 1,373 57.0 Registered electors 9,985 Turnout 2,473 24.8 Rejected ballots 12 0.5 Labour hold Swing
[6] [7]
Birkenhead and Tranmere Birkenhead and Tranmere Party Candidate Votes % ±% Labour Jean Stapleton 1,555 47.9 Green Steve Hayes 1,383 42.6 UKIP Graeme Foster 203 6.3 Conservative June Cowin 59 1.8 Liberal Democrats Mary Price 35 1.1 TUSC Jack Yarlett 11 0.3 New Majority 172 5.3 Registered electors 9,703 Turnout 3,264 33.6 Rejected ballots 18 0.6 Labour hold Swing
[8] [9] [10]
Bromborough Bromborough Party Candidate Votes % ±% Labour Warren Ward 1,805 50.5 Independent Steve Niblock [n 2] 985 27.6 N/A Conservative Pete Welch 442 12.4 Liberal Democrats Jennifer Lane 151 4.2 Green Percy Hogg 131 3.7 TUSC Mark Halligan 60 1.7 Majority 820 22.9 Registered electors 11,384 Turnout 3,599 31.6 Rejected ballots 25 0.7 Labour gain from Independent Swing
[11] [12] [13]
Clatterbridge Clatterbridge Party Candidate Votes % ±% Conservative Cherry Povall 2,333 51.7 Labour Jenny Holliday 1,668 37.0 Liberal Democrats Jan Cambridge 334 7.4 Green Jim McGinley 177 3.9 Majority 665 14.7 Registered electors 11,454 Turnout 4,538 39.6 Rejected ballots 26 0.6 Conservative hold Swing
[14] [15]
Claughton Claughton Party Candidate Votes % ±% Labour George Davies 2,337 66.6 Conservative Barbara Sinclair 628 17.9 Liberal Democrats Christopher Teggin 237 6.8 Green Moira Gommon 219 6.2 TUSC Phil Simpson 89 2.5 New Majority 1709 48.7 Registered electors 11,161 Turnout 3,372 31.6 Rejected ballots 22 0.6 Labour hold Swing
[16] [17]
Eastham Eastham Party Candidate Votes % ±% Liberal Democrats Phillip Gilchrist 2,695 67.0 Labour Giuseppe Roberto 951 23.6 Conservative Peter Taylor 294 7.1 Green Perle Sheldricks 83 2.1 Majority 1,744 43.4 Registered electors 10,995 Turnout 4,050 36.8 Rejected ballots 27 0.7 Liberal Democrats hold Swing
[18] [19]
Greasby, Frankby and Irby Greasby, Frankby and Irby Party Candidate Votes % ±% Conservative Tom Anderson 2,182 48.5 Labour Frank Harrison 1,294 28.8 Liberal Democrats John Cresswell 792 17.6 Green Cathy Page 232 5.2 Majority 888 19.7 Registered electors 11,369 Turnout 4,529 39.8 Rejected ballots 29 0.6 Conservative hold Swing
[20] [21]
Heswall Heswall Party Candidate Votes % ±% Conservative Kathryn Hodson 2,776 65.0 Labour Jeff Judge 868 20.3 Green Barbara Burton 334 7.8 Liberal Democrats David Tyrrell 290 6.8 Majority 1908 44.7 Registered electors 10,768 Turnout 4,304 40.0 Rejected ballots 24 0.6 Conservative hold Swing
[22] [23]
Hoylake and Meols Hoylake and Meols Party Candidate Votes % ±% Conservative John Hale 2,186 54.2 Labour Jean Robinson 1,218 30.2 Green Alix Cockcroft 372 9.2 Liberal Democrats Peter Reisdorf 261 6.5 Majority 968 24.0 Registered electors 10,429 Turnout 4,063 39.0 Rejected ballots 26 0.6 Conservative hold Swing
[24] [25] [26] [27]
Leasowe and Moreton East Leasowe and Moreton East Party Candidate Votes % ±% Labour Anita Leech 2,349 69.3 Conservative William Eborall 802 23.7 Green Gillian Homeri 240 7.1 Majority 1,547 45.6 Registered electors 10,690 Turnout 3,413 31.9 Rejected ballots 22 0.6 Labour hold Swing
[28] [29]
Liscard Liscard (2) Party Candidate Votes % ±% Labour Tom Usher [n 3] 2,240 55.3 Labour Janette Williamson [n 4] 1,672 – – Conservative Ann Lavin 690 17.0 New UKIP Lynda Williams 504 12.4 Conservative Ann Parry 427 – – Green Trevor Desrosiers 338 8.3 Liberal Democrats Daniel Clein 280 6.9 Majority 1,550 38.3 Registered electors 10,982 Turnout 3,604 32.8 Rejected ballots 12 0.3 Labour hold Swing Labour hold Swing –
[30] [31] [32]
Moreton West and Saughall Massie Moreton West and Saughall Massie Party Candidate Votes % ±% Conservative Chris Blakeley 2,384 56.8 Labour Karl Greaney 1,425 34.0 UKIP Beryl Jones 301 7.2 Green Lindsey Stowell-Smith 86 2.0 Majority 959 22.8 Registered electors 10,682 Turnout 4,213 39.4 Rejected ballots 17 0.4 Conservative hold Swing
[33] [34]
New Brighton New Brighton Party Candidate Votes % ±% Labour Tony Jones 2,214 51.9 Conservative Tony Pritchard 1,452 34.1 UKIP Paula Walters 257 6.0 Green Cynthia Stonall 197 4.6 Liberal Democrats Jackie Usher 93 2.2 New TUSC Gregory North 51 1.2 New Majority 762 17.8 Registered electors 10,946 Turnout 4,280 39.1 Rejected ballots 16 0.4 Labour hold Swing
[35] [36] [37]
Oxton Oxton Party Candidate Votes % ±% Liberal Democrats Stuart Kelly 2,381 54.0 Labour Vicky Nowak 1,568 35.6 Conservative Philip Merry 275 6.2 Green Liz Heydon 183 4.2 Majority 813 18.4 N/A Registered electors 11,044 Turnout 4,434 40.1 Rejected ballots 27 0.6 Liberal Democrats hold Swing
[38] [39]
Pensby and Thingwall Pensby and Thingwall Party Candidate Votes % ±% Labour Mike Sullivan 2,243 48.5 Conservative Andrew Gardner 1,541 33.3 UKIP Jan Davison 417 9.0 Liberal Democrats Damien Cummins 296 6.4 Green Allen Burton 125 2.7 Majority 702 15.2 Registered electors 10,388 Turnout 4,651 44.8 Rejected ballots 29 0.6 Labour hold Swing
[40] [41] [42]
Prenton Prenton Party Candidate Votes % ±% Labour Tony Norbury 2,028 60.3 Conservative Hilary Jones 647 19.2 Liberal Democrats Allan Brame 355 10.6 Green Christopher Cooke 334 9.9 Majority 1,381 41.1 Registered electors 10,680 Turnout 3,401 31.8 Rejected ballots 37 1.1 Labour hold Swing
[43] [44] [45] [46]
Rock Ferry Rock Ferry Party Candidate Votes % ±% Labour Bill Davies 1,642 66.8 UKIP Billy Foster 327 13.3 Conservative Robert Hughes 209 8.5 Green Kenny Peers 158 6.4 Liberal Democrats Edward Smith 86 3.5 TUSC Leah Halligan 38 1.5 Majority 1,315 53.4 Registered electors 9,641 Turnout 2,480 25.7 Rejected ballots 20 0.8 Labour hold Swing
[47] [48]
Seacombe Seacombe Party Candidate Votes % ±% Labour Paul Stuart 2,245 85.3 Conservative John Laing 386 14.7 Majority 1,859 70.7 Registered electors 10,091 Turnout 2,690 26.7 Rejected ballots 59 2.2 Labour hold Swing
[49] [50]
Upton Upton Party Candidate Votes % ±% Labour Matthew Patrick 2,218 61.0 Conservative Geoffrey Gubb 900 24.7 Green Lily Clough 256 7.0 Liberal Democrats Alan Davies 169 4.6 TUSC Philip Jones 94 2.6 New Majority 1,318 36.3 Registered electors 12,181 Turnout 3,693 30.3 Rejected ballots 56 1.5 Labour hold Swing
[51] [52]
Wallasey Wallasey Party Candidate Votes % ±% Conservative Ian Lewis 2,249 50.1 Labour Bill McGenity 1,574 35.1 Green John Rodgers 241 5.4 UKIP Adam Heatherington 234 5.2 Liberal Democrats John Codling 191 4.3 Majority 675 15.0 Registered electors 11,672 Turnout 4,508 38.6 Rejected ballots 19 0.4 Conservative hold Swing
[53] [54]
West Kirby and Thurstaston West Kirby and Thurstaston Party Candidate Votes % ±% Conservative Geoffrey Watt 2,379 57.5 Labour James Laing 1,182 28.6 Green Yvonne McGinley 320 7.7 Liberal Democrats Mike Redfern 255 6.2 Majority 1,197 28.9 Registered electors 10,198 Turnout 4,162 40.8 Rejected ballots 26 0.6 Conservative hold Swing
[55] [56]
Changes between 2016 and 2018 Claughton by-election 2017 By-election, 4 May 2017: Claughton Party Candidate Votes % ±% Labour Gillian Wood 1,761 52.4 Liberal Democrats David Evans 740 22.0 Conservative Barbara Sinclair 567 16.9 Green Liz Heydon 136 4.1 UK_Independence_Party Beryl Jones 130 3.9 New TUSC Leon Wheddon 27 0.8 Majority 976 30.4 Registered electors 11,336 Turnout 3,372 29.7 Rejected ballots 11 0.3 Labour hold Swing
[57] [58]
Notes ^ % of total refers to % of wards won.^ Deselected by Labour Party. ^ Elected to serve a 4-year term. ^ Elected to serve a 2-year term. • italics denote the sitting councillor • bold denotes the winning candidate
References

 33.5%)[1]
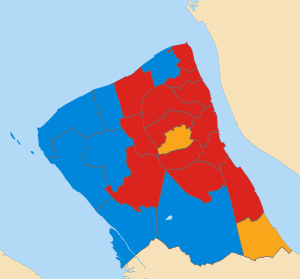


 1
1 


