2004 UK local government election
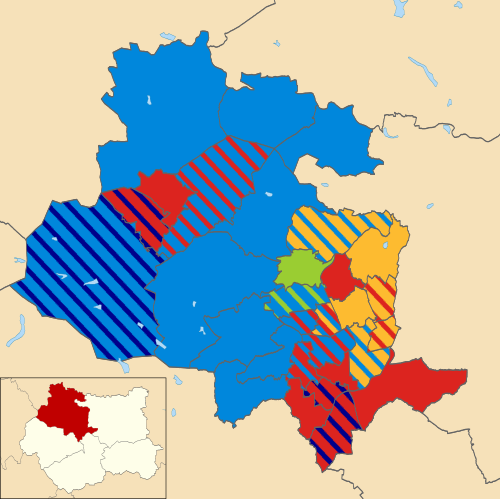
Map of the results of the 2004 Bradford Council election. Conservatives in blue, Labour in red, Liberal Democrats in yellow, Green in green and BNP in navy blue. Elections to City of Bradford Metropolitan District Council [1] [2]
Election result Bradford Local Election Result 2004[1] Party Seats Gains Losses Net gain/loss Seats % Votes % Votes +/− Conservative 38 0 0 42.2 31.7 54,339 N/A Labour 29 0 0 32.2 26.9 46,135 N/A Liberal Democrats 15 0 0 16.7 23.3 40,012 N/A Green 4 0 0 4.4 7.1 12,250 N/A BNP 4 0 0 4.4 7.0 12,079 N/A Independent 0 0 0 0.0 3.0 5,170 N/A UKIP 0 0 0 0.0 0.9 1,487 N/A
This result had the following consequences for the total number of seats on the council after the elections:
Party Previous council New council Conservative 36 38 Labour 36 29 Liberal Democrat 14 15 Green 3 4 BNP 4 4 Independent 1 0 Total 90 90 Working majority -18 -14
Ward results Baildon[1] Party Candidate Votes % ±% Liberal Democrats John Malcolm Charles Cole 2,948 44.7 N/A Liberal Democrats John Briggs 2,482 Conservative Valerie Margaret Townend 2,343 35.5 N/A Liberal Democrats Christine Betty Briggs 2,314 Conservative Roger L'Amie 2,178 Conservative Michael George Ellis 1,908 Labour Miranda Elizabeth Vasey 751 11.4 N/A Labour James Robert Flood 676 Green John Patrick William Foster 549 8.3 N/A Labour George Pope 539 Majority 29 9.2 N/A Turnout 6,115 52.8 N/A Liberal Democrats win (new seat) Liberal Democrats win (new seat) Conservative win (new seat)
Bingley[1] Party Candidate Votes % ±% Conservative Colin Mathew Gill 3,229 46.5 N/A Conservative Robin Ernest Owens 2,962 Conservative David Heseltine 2,941 Labour Eileen Mary Sinclair 1,551 22.4 N/A Labour Frank Roy Needham 1,529 Labour Michael Swales 1,385 Liberal Democrats John Robert Watmough 1,211 17.4 N/A Green Arthur Albert John Arnold 947 13.6 N/A Liberal Democrats Susan Valerie Whelan 759 Liberal Democrats David Nicholas Lerner 642 Majority 1,390 24.2 N/A Turnout 6,371 51.5 N/A Conservative win (new seat) Conservative win (new seat) Conservative win (new seat)
Bingley Rural[1] Party Candidate Votes % ±% Conservative Ellen Margaret Eaton 3,526 54.1 N/A Conservative Andrew Simon Cooke 3,199 Conservative Juliette Margaret Kinsey 3,081 Labour James Albert Newton 1,139 17.5 N/A Labour Lawrence William Cooper 1,089 Liberal Democrats Laura Jane Cole 1,019 15.6 N/A Liberal Democrats Margaret Helen Fielden 936 Green Brian Newham 829 12.7 N/A Liberal Democrats Karl Spracklen 784 Labour Ranjit Kaur Arora 707 Majority 1,942 36.6 N/A Turnout 6,155 47.7 N/A Conservative win (new seat) Conservative win (new seat) Conservative win (new seat)
Bolton and Undercliffe[1] Party Candidate Votes % ±% Liberal Democrats Robert Christopher Hargreaves 2,326 51.2 N/A Liberal Democrats Howard Middleton 2,247 Liberal Democrats David Weston Gray 2,244 Conservative Richard Brodowski 881 19.4 N/A Labour Rita Maria Goulden 867 19.1 N/A Conservative Peter Benson 772 Labour Jagtar Singh Deol 766 Conservative John Antony Robertshaw 699 Labour Mohammad Yaqoob 675 Green Steven Schofield 472 10.4 N/A Majority 1,363 31.8 N/A Turnout 4,656 42.3 N/A Liberal Democrats win (new seat) Liberal Democrats win (new seat) Liberal Democrats win (new seat)
Bowling and Barkerend[1] Party Candidate Votes % ±% Liberal Democrats Rupert Oliver 2,448 44.6 N/A Conservative Mohammed Jamil 1,827 33.3 N/A Liberal Democrats Mukhtar Ali 1,810 Liberal Democrats Ghulam Rabani Chaudhury 1,770 Conservative Zameer Hussain Shah 1,679 Conservative Dawood Ismail Karim 1,545 Labour Raymond Bage 1,212 22.1 N/A Labour Anthony Niland 1,196 Labour Shofiqul Islam 977 Majority 131 11.3 N/A Turnout 5,759 49.0 N/A Liberal Democrats win (new seat) Conservative win (new seat) Liberal Democrats win (new seat)
Bradford Moor [1] Party Candidate Votes % ±% Liberal Democrats Riaz Ahmed 2,508 40.0 N/A Labour Ghazanfer Khaliq 2,396 38.2 N/A Liberal Democrats Diloar J Ali 2,091 Labour Shakeela Jan Lal 1,887 Liberal Democrats Abdul Aziz 1,519 Labour Taj Mubarik Salam 1,472 Conservative Habib-Ur Rehman 1,373 21.9 N/A Conservative Mohammed Aslam Choudary 1,362 Conservative Shafiquddin Chohan 1,040 Majority 204 1.8 N/A Turnout 6,150 55.7 N/A Liberal Democrats win (new seat) Labour win (new seat) Liberal Democrats win (new seat)
City[1] Party Candidate Votes % ±% Labour Sajawal Hussain 2,501 35.7 N/A Conservative Jamshed Khan 2,141 30.6 N/A Conservative Khadam Hussain 1,930 Labour Munir Ahmed 1,704 Liberal Democrats Arshad Mansoor Haider Raja 1,546 22.1 N/A Liberal Democrats Sharaz Akhtar 1,529 Labour Evelyne Godfrey 1,439 Green John Edward Robinson 810 11.6 N/A Conservative Joyce Audrey Green 622 Majority 226 5.1 N/A Turnout 6,203 57.1 N/A Labour win (new seat) Conservative win (new seat) Conservative win (new seat)
Clayton & Fairweather Green[1] Party Candidate Votes % ±% Conservative Elaine Byrom 2,039 37.5 N/A Conservative Charles Malcolm Sykes 1,572 Conservative David John Servant 1,509 Liberal Democrats Lorna Mary Ruth Leeming 1,230 22.6 N/A Labour Mohammed Latif Darr 1,124 20.6 N/A BNP Stuart George Kilminster 1,049 19.3 N/A Labour Mohammed Abdus Salam 979 Labour Mohammed Shafiq 879 Liberal Democrats James Emile Mangeolles 780 Majority 279 14.9 N/A Turnout 4,773 43.6 N/A Conservative win (new seat) Conservative win (new seat) Conservative win (new seat)
Craven[1] Party Candidate Votes % ±% Conservative David Robert Emmott 3,014 43.6 N/A Conservative Michael John Kelly 2,726 Conservative Andrew Charles Mallinson 2,646 Independent Christopher Micheal Atkinson 1,408 20.4 N/A Labour Francis Melvyn Harrison 1,281 18.5 N/A Liberal Democrats Elizabeth Wells 1,207 17.5 N/A Labour Lorraine Margaret Harding 1,200 Liberal Democrats Hamish Gordon Hay 1,198 Labour Garrath Julian Earnshaw 848 Liberal Democrats Gordon Tarek Ahmadi 563 Majority 1,238 23.2 N/A Turnout 6,152 50.3 N/A Conservative win (new seat) Conservative win (new seat) Conservative win (new seat)
Eccleshill [1] Party Candidate Votes % ±% Liberal Democrats Dorothy Ann Wallace 1,359 32.5 N/A Liberal Democrats Carol Beardmore 1,352 Labour Anne-Marie Benson 1,237 29.6 N/A Labour Robert Sowman 1,223 Liberal Democrats Alun Owen Griffiths 1,206 Labour James O'Neill 1,161 Conservative James Ralph Ryder 1,088 26.0 N/A Conservative Harry Lycett 1,036 Conservative Dorothy Ward 1,006 Green Joan Audrey Foulds 498 11.9 N/A Majority 31 2.9 N/A Turnout 4,347 38.1 N/A Liberal Democrats win (new seat) Liberal Democrats win (new seat) Labour win (new seat)
Great Horton [1] Party Candidate Votes % ±% Labour Paul John Flowers 2,089 37.2 N/A Conservative Intkhab Alam 1,640 29.2 N/A Labour John Derek Godward 1,617 Labour Elizabeth Mary Devlin 1,341 Liberal Democrats Mansha Maqsood 1,251 22.3 N/A Conservative Richard Milczanowski 1,228 Liberal Democrats Margaret Isabel Chadwick 1,028 Liberal Democrats John Robert Saul 994 Conservative Mohammed Sadiq 755 Green Derek Curtis 641 11.4 N/A Majority 366 8.0 N/A Turnout 5,409 49.3 N/A Labour win (new seat) Conservative win (new seat) Labour win (new seat)
Heaton [1] Party Candidate Votes % ±% Conservative John Stanley King 1,816 29.8 N/A Green David Michael Ford 1,531 25.1 N/A Conservative Mohammad Masood 1,355 Labour Andrew Craig Pitts 1,280 21.0 N/A Conservative Paul Trevor Smith 1,251 Liberal Democrats Tariq Mahmood 1,127 18.5 N/A Green Parvez Darr 1,119 Labour Mark Fielding 1,069 Labour Gillian Margaret Thornton 943 Green Mohammed Hanif Qureshi 892 Liberal Democrats Farhan Hussain Khokhar 631 Liberal Democrats Ansar Ali Mirza 591 Independent Alan Hugh Carling 342 5.6 N/A Majority 285 4.7 N/A Turnout 5,357 54.4 N/A Conservative win (new seat) Green win (new seat) Conservative win (new seat)
Idle and Thackley [1] Party Candidate Votes % ±% Liberal Democrats Ann Lesley Ozolins 2,581 46.2 N/A Liberal Democrats Jeanette Sunderland 2,525 Liberal Democrats David Ward 2,384 Conservative Anthony James Nigel Wood 1,042 18.6 N/A Conservative Joan Marie Small 958 Conservative Edward Christopher Ward 954 BNP Stewart Paul Williams 877 15.7 N/A Labour Anthony Devaney 636 11.4 N/A Labour Helen Josephine Difiori 610 Labour Folayemi Olaniyi Adisa-Adesina 456 Green Judith Wever 454 8.1 N/A Majority 1,342 27.5 N/A Turnout 5,303 46.6 N/A Liberal Democrats win (new seat) Liberal Democrats win (new seat) Liberal Democrats win (new seat)
Ilkley [1] Party Candidate Votes % ±% Conservative Anne Gillian Hawkesworth 3,775 60.6 N/A Conservative Brian Martin Smith 3,359 Conservative Colin George Powell 3,290 Liberal Democrats Richard William Quayle 1,302 20.9 N/A Liberal Democrats Samuel Edwin Harris 1,230 Labour Christopher James Ramage 1,153 18.5 N/A Liberal Democrats Tomasz John Pierscionek 1,080 Labour Peter Cheney 1,075 Labour James William Pressley 938 Majority 1,988 39.7 N/A Turnout 6,140 55.7 N/A Conservative win (new seat) Conservative win (new seat) Conservative win (new seat)
Keighley Central [1] Party Candidate Votes % ±% Labour Khadim Hussain 2,626 45.9 N/A Labour Lynne Joyce 2,231 Labour John Morris Prestage 1,850 Conservative Javaid Akhtar 1,584 27.7 N/A Liberal Democrats Christopher John Campbell Brown 1,512 26.4 N/A Liberal Democrats Kaneez Akthar 1,417 Conservative Arshed Majeed 1,397 Conservative Amran Ali 1,255 Liberal Democrats Javed Bashir 1,086 Majority 266 18.2 N/A Turnout 6,018 55.9 N/A Labour win (new seat) Labour win (new seat) Labour win (new seat)
Keighley East [1] Party Candidate Votes % ±% Labour Malcolm Slater 2,037 30.1 N/A Conservative Dorothy Clamp 1,687 24.9 N/A Conservative Mark Francis Startin 1,632 Labour Maxine Anne Hepworth 1,464 BNP Victor William Collier 1,407 20.8 N/A Conservative John Anthony Carroll 1,368 Labour Andrew Peter Alan Dundas 1,243 Liberal Democrats Judith Brooksbank 1,002 14.8 N/A Green John Francis Love 634 9.4 N/A Liberal Democrats Ali Akbar 628 Liberal Democrats James Stewart Main 550 Majority 168 5.2 N/A Turnout 5,662 50.4 N/A Labour win (new seat) Conservative win (new seat) Conservative win (new seat)
Keighley West [1] Party Candidate Votes % ±% BNP Angela Clarke 1,659 29.1 N/A Labour Irene Ellison-Wood 1,417 24.8 N/A Labour Catherine Mary Rowen 1,354 Conservative John Rennie Philip 1,142 20.0 N/A Conservative Lucy Wilkinson 1,108 Labour Eileen McNally 1,073 Independent Brian Hudson 903 15.8 N/A Conservative David John Herdson 895 Independent Anthony Wright 584 Liberal Democrats Douglas Roger Beaumont 582 10.2 N/A Liberal Democrats James Francis Keeley 399 Liberal Democrats Barbara Pierscionek 345 Majority 212 4.2 N/A Turnout 5,009 45.6 N/A BNP win (new seat) Labour win (new seat) Labour win (new seat)
Little Horton [1] Party Candidate Votes % ±% Labour Ian Greenwood 2,436 51.4 N/A Labour Sher Khan 2,415 Labour Naveeda Ikram 2,129 Conservative Asad Mercury Malik 922 19.4 N/A Liberal Democrats John Brian Massen 785 16.6 N/A Liberal Democrats Rahmat Ullah 770 Conservative Zubeda Begum 762 Green John Charles McKenny 598 12.6 N/A Liberal Democrats Tahir Mahmood 588 Conservative Mohammed Afzal 488 Majority 1,207 31.9 N/A Turnout 5,094 50.1 N/A Labour win (new seat) Labour win (new seat) Labour win (new seat)
Manningham [1] Party Candidate Votes % ±% Liberal Democrats Mohammed Ishrat Mirza 2,415 38.2 N/A Labour Choudhary Rangzeb 2,104 33.2 N/A Conservative Reis Khan 1,810 28.6 N/A Conservative Raza Ghalib Hussain 1,731 Labour Susanne Rooney 1,700 Labour Shabir Hussain 1,637 Liberal Democrats Mohammed Rafiq Sehgal 1,596 Conservative Mohammed Ashraf Miah 1,198 Liberal Democrats Mohammed Shafiq-Ul Islam 1,150 Majority 79 4.9 N/A Turnout 6,922 66.5 N/A Liberal Democrats win (new seat) Labour win (new seat) Conservative win (new seat)
Queensbury [1] Party Candidate Votes % ±% Conservative Michael Walls 1,827 31.3 N/A Conservative Stuart Hanson 1,823 Conservative Tracey McNulty 1,648 BNP Paul Gregory Smith Cromie 1,411 24.2 N/A BNP Lynda Jane Cromie 1,259 Labour David Warburton 1,140 19.6 N/A Labour Alan Frederick Wainwright 1,051 Labour Graham Vincent Mahony 1,036 Independent Andrew Stephen Smith 992 17.0 N/A Liberal Democrats Helen Wright 458 7.9 N/A Liberal Democrats Cedric Wilson 430 Majority 237 7.1 N/A Turnout 5,085 47.9 N/A Conservative win (new seat) Conservative win (new seat) Conservative win (new seat)
Royds [1] Party Candidate Votes % ±% Labour Andrew Thornton 1,795 39.1 N/A Labour Judith Mary Black 1,784 Labour Valerie Slater 1,608 BNP David Roy Midgley 1,258 27.4 N/A Conservative Robert James Stead 1,038 22.6 N/A Conservative Margaret Christine Jordan 965 Conservative Jacqueline Lesley Walls 876 Liberal Democrats Edward John Hallmann 498 10.8 N/A Liberal Democrats Colleen Middleton 496 Majority 350 11.7 N/A Turnout 4,401 40.5 N/A Labour win (new seat) Labour win (new seat) Labour win (new seat)
Shipley [1] Party Candidate Votes % ±% Green Martin John Love 2,497 41.9 N/A Green Kevin Robert Warnes 2,010 Green Hawarun Nessa Hussain 1,801 Conservative Geraldine Whelan 1,585 26.6 N/A Conservative Keith Jepson 1,504 Conservative Andrew Tuppen 1,355 Labour Mark Richard Blackburn 1,112 18.6 N/A Labour Gareth David Logan 926 Labour Barry Kenneth Thorne 911 Liberal Democrats Alexander John Cole 771 12.9 N/A Liberal Democrats Joan McCree Edbury 629 Liberal Democrats Carl John Dickerson 561 Majority 216 15.3 N/A Turnout 5,532 52.2 N/A Green win (new seat) Green win (new seat) Green win (new seat)
Thornton and Allerton [1] Party Candidate Votes % ±% Conservative Clive Thomas Richardson 1,993 32.0 N/A Conservative Michael Evan McCabe 1,851 Conservative Valerie Binney 1,770 UKIP Melanie Jane Milnes 1,487 23.9 N/A Labour John Jevon Samuel 1,047 16.8 N/A Liberal Democrats Susan Elizabeth Fletcher 874 14.0 N/A Green Michael Anthony Rawnsley 832 13.3 N/A Liberal Democrats David George Weston 819 Labour Aurang Zeb Khan 545 Labour Hassan Uzzaman Khan 527 Majority 283 8.1 N/A Turnout 4,903 44.1 N/A Conservative win (new seat) Conservative win (new seat) Conservative win (new seat)
Toller [1] Party Candidate Votes % ±% Conservative Arshad Hussain 2,926 40.9 N/A Labour Amir Hussain 2,825 39.5 N/A Conservative Amjad Hussain 2,537 Labour Imran Hussain 2,457 Liberal Democrats Mahmood Hussain 1,398 19.6 N/A Labour Olayemi Fagborun 1,185 Conservative Qurban Hussain Malik 1,044 Liberal Democrats Christine Reid 1,035 Liberal Democrats Zubair Hussain 806 Majority 80 1.4 N/A Turnout 7,089 65.3 N/A Conservative win (new seat) Labour win (new seat) Conservative win (new seat)
Tong[1] Party Candidate Votes % ±% Labour Michael Johnson 1,714 55.1 N/A Labour John Ruding 1,683 Labour James Anthony Cairns 1,478 Liberal Democrats Joan Collins 713 22.9 N/A Conservative Derek Ernest Green 684 22.0 N/A Conservative Garry Robert Walls 672 Liberal Democrats Janet Margaret Blenkey 667 Liberal Democrats Colin George McPhee 650 Conservative Afaq Alam 502 Majority 765 32.2 N/A Turnout 3,574 32.6 N/A Labour win (new seat) Labour win (new seat) Labour win (new seat)
Wharfedale[1] Party Candidate Votes % ±% Conservative Dale Smith 2,028 44.0 N/A Conservative Matthew James Steven Palmer 2,004 Conservative Christopher Ian Greaves 1,984 Liberal Democrats Vernon Patrick Harcourt Whelan 1,313 28.5 N/A Liberal Democrats Francis Rowland Dale 858 Liberal Democrats Alan Sykes 804 Labour Elaine Christine Cooper 706 15.3 N/A Labour Ronda Lesley Christensen 668 Labour Lorraine Colette Kirkwood 657 Green Julie Jane Cowdery 562 12.2 N/A Majority 671 15.5 N/A Turnout 4,961 55.7 N/A Conservative win (new seat) Conservative win (new seat) Conservative win (new seat)
Wibsey [1] Party Candidate Votes % ±% Labour David Michael Adam Green 1,460 30.8 N/A Labour Ralph David Ritchie Berry 1,426 BNP Arthur Collins Redfearn 1,355 28.6 N/A Conservative Dorothy Craven 1,341 28.3 N/A Labour Lynne Eleanor Smith 1,331 Conservative Richard Ian Sheard 1,279 Conservative Mark Holden 1,234 Liberal Democrats Brian Moore 581 12.3 N/A Liberal Democrats Abdul Hafeez 380 Majority 14 2.2 N/A Turnout 4,620 43.5 N/A Labour win (new seat) Labour win (new seat) BNP win (new seat)
Windhill and Wrose [1] Party Candidate Votes % ±% Labour Phillip Thornton 1,572 34.7 N/A Labour Tony Miller 1,423 Labour Vanda Greenwood 1,268 Liberal Democrats Ronald Craig 1,137 25.1 N/A Liberal Democrats John Hall 960 Liberal Democrats Marian Hughes Taylor 911 Conservative Derek Taylor 884 19.5 N/A Conservative Deborah Gail Davies 856 Conservative David James 804 Independent Michael Breen 542 12.0 N/A Green Robert Minter Nicholls 396 8.7 N/A Majority 131 9.6 N/A Turnout 4,151 39.2 N/A Labour win (new seat) Labour win (new seat) Labour win (new seat)
Worth Valley [1] Party Candidate Votes % ±% Conservative Kristan Frederick Hopkins 1,734 26.7 N/A Conservative Peter Henry Hill 1,651 BNP Christopher Neil Kirby 1,480 22.8 N/A Conservative Glen William Miller 1,473 Labour Mark Bernard Curtis 1,227 18.9 N/A Labour Trevor Lindley 1,109 Liberal Democrats John Hopkinson 1,074 16.5 N/A Independent David Samuels 983 15.1 N/A Liberal Democrats Glynis Gumbley 940 Labour Carolyn Gibbons Lowing 881 Majority 7 3.9 N/A Turnout 5,372 52.9 N/A Conservative win (new seat) Conservative win (new seat) BNP win (new seat)
Wyke [1] Party Candidate Votes % ±% Labour David Alexander Robinson 1,700 30.7 N/A BNP James Graham Lewthwaite 1,583 28.6 N/A Labour Max Cummins 1,421 Conservative Paul Steven Jordan 1,420 25.6 N/A Labour Rosemary Watson 1,363 Conservative John Arthur Stead 1,194 Conservative Gordon Johnson 1,060 Liberal Democrats David Andrew Christie 836 15.1 N/A Liberal Democrats Kevin Anthony Hall 621 Majority 1 2.1 N/A Turnout 4,962 46.4 N/A Labour win (new seat) BNP win (new seat) Labour win (new seat)
By-elections between 2004 and 2006 Craven By-Election 16 March 2006[3] Party Candidate Votes % ±% Conservative Andrew Naylor 1,304 57.0 +13.4 Labour Steven Carter 669 29.2 +10.7 Liberal Democrats Frances McAulay 315 13.8 -3.7 Majority 635 27.8 +4.6 Turnout 2,288 18.7 -31.6 Conservative hold Swing +1.3
Keighley West By-Election 23 March 2006[3] Party Candidate Votes % ±% Labour Angela Sinfield 1,819 47.0 +22.2 BNP Ian Dawson 1,216 31.4 +2.3 Conservative Lionel Lockley 627 16.2 -3.8 Liberal Democrats Victoria Salmons 208 5.4 -4.8 Majority 603 15.6 +11.4 Turnout 3,870 35.1 -10.5 Labour gain from BNP Swing +9.9
References ^ a b c d e f g h i j k l m n o p q r s t u v w x y z aa ab ac ad ae af "Local Election Results 2004" (PDF) . bradford.gov.uk. Archived from the original (PDF) on 23 September 2015. Retrieved 30 August 2015 . ^ "Vote 2012: Bradford". BBC News Online . Retrieved 1 August 2015 . ^ a b "Local Authority Byelection Results". gwydir.demon.co.uk. Archived from the original on 29 March 2010. Retrieved 10 August 2015 .

 Council elections in West Yorkshire


