2006 Trafford Metropolitan Borough Council election
2006 UK local government election
 | |||||||||||||||||||||||||||||||||||||||||||||||||||||
21 of 63 seats to Trafford Metropolitan Borough Council 32 seats needed for a majority | |||||||||||||||||||||||||||||||||||||||||||||||||||||
|---|---|---|---|---|---|---|---|---|---|---|---|---|---|---|---|---|---|---|---|---|---|---|---|---|---|---|---|---|---|---|---|---|---|---|---|---|---|---|---|---|---|---|---|---|---|---|---|---|---|---|---|---|---|
| |||||||||||||||||||||||||||||||||||||||||||||||||||||
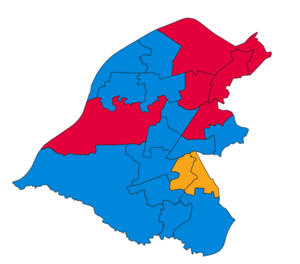 Map of results of 2006 election | |||||||||||||||||||||||||||||||||||||||||||||||||||||
| |||||||||||||||||||||||||||||||||||||||||||||||||||||
Elections to Trafford Council were held on 4 May 2006. One third of the council was up for election, with each successful candidate to serve a four-year term of office, expiring in 2010. The Conservative Party retained overall control of the council.
Election result
| Party | Votes | Seats | Full Council | |||||||
| Conservative Party | 27,936 (48.0%) |  5.0 5.0 | 13 (61.9%) | 13 / 21 | 1 | 39 (61.9%) | 39 / 63 | |||
| Labour Party | 17,475 (30.0%) |  1.0 1.0 | 6 (28.6%) | 6 / 21 |  | 20 (31.7%) | 20 / 63 | |||
| Liberal Democrats | 7,359 (12.6%) | 2.9 | 2 (9.5%) | 2 / 21 | 1 | 4 (6.3%) | 4 / 63 | |||
| Green Party | 5,151 (8.9%) | 6.9 | 0 (0.0%) | 0 / 21 | | 0 (0.0%) | 0 / 63 | |||
| Independent | 156 (0.3%) | N/A | 0 (0.0%) | 0 / 21 | N/A | 0 (0.0%) | 0 / 63 | |||
| UKIP | 148 (0.3%) | N/A | 0 (0.0%) | 0 / 21 | N/A | 0 (0.0%) | 0 / 63 | |||
| 20 | 4 | 39 |
Ward results
Altrincham
| Party | Candidate | Votes | % | ±% | |
|---|---|---|---|---|---|
| Conservative | Michael Young | 1,430 | 53.6 | −17.6 | |
| Labour | Peter Baugh | 611 | 22.9 | +7.2 | |
| Liberal Democrats | Roger Legge | 404 | 15.1 | +2.0 | |
| Green | Jadwiga Leigh | 225 | 8.4 | +8.4 | |
| Majority | 819 | 30.7 | +2.8 | ||
| Turnout | 2,670 | 35.7 | −11.5 | ||
| Conservative hold | Swing | ||||
Ashton upon Mersey
| Party | Candidate | Votes | % | ±% | |
|---|---|---|---|---|---|
| Conservative | John Lamb* | 1,645 | 58.4 | +3.3 | |
| Labour | Sophie Taylor | 728 | 25.9 | −4.0 | |
| Green | Daniel Leach | 442 | 15.7 | +9.3 | |
| Majority | 917 | 32.5 | +14.0 | ||
| Turnout | 2,815 | 39.4 | −10.5 | ||
| Conservative hold | Swing | ||||
Bowdon
| Party | Candidate | Votes | % | ±% | |
|---|---|---|---|---|---|
| Conservative | Paula Pearson* | 2,085 | 69.8 | −8.2 | |
| Liberal Democrats | Ian Chappell | 385 | 12.9 | +3.2 | |
| Labour | Thomas Hague | 300 | 10.1 | +3.7 | |
| Green | Bridget Green | 216 | 7.2 | +1.3 | |
| Majority | 1,700 | 56.9 | +9.9 | ||
| Turnout | 2,986 | 41.7 | −12.0 | ||
| Conservative hold | Swing | ||||
Broadheath
| Party | Candidate | Votes | % | ±% | |
|---|---|---|---|---|---|
| Conservative | James Pearson* | 1,392 | 49.6 | −8.8 | |
| Labour | Ian Golding | 725 | 25.8 | −9.0 | |
| Liberal Democrats | Pauline Cliff | 428 | 15.2 | +8.5 | |
| Green | Martin Bate | 263 | 9.4 | +9.4 | |
| Majority | 667 | 23.8 | −7.9 | ||
| Turnout | 2,808 | 35.8 | −9.5 | ||
| Conservative hold | Swing | ||||
Brooklands
| Party | Candidate | Votes | % | ±% | |
|---|---|---|---|---|---|
| Conservative | Pamela Dixon* | 1,808 | 59.5 | −20.7 | |
| Liberal Democrats | Kenneth Clarke | 722 | 23.8 | +7.3 | |
| Labour | Angela Gratrix | 509 | 16.8 | +16.8 | |
| Majority | 1,086 | 35.7 | +10.3 | ||
| Turnout | 3,039 | 38.9 | −10.5 | ||
| Conservative hold | Swing | ||||
Bucklow-St. Martin's
| Party | Candidate | Votes | % | ±% | |
|---|---|---|---|---|---|
| Labour | David Quayle* | 967 | 53.5 | −13.1 | |
| Conservative | Anne Cavanagh | 560 | 31.0 | −2.4 | |
| Green | William Gradwell | 280 | 15.5 | +15.5 | |
| Majority | 407 | 22.5 | −7.4 | ||
| Turnout | 1,807 | 28.0 | −6.7 | ||
| Labour hold | Swing | ||||
Clifford
| Party | Candidate | Votes | % | ±% | |
|---|---|---|---|---|---|
| Labour | Andrea Jones* | 1,375 | 64.0 | +17.7 | |
| Green | Anne Power | 413 | 19.2 | +7.5 | |
| Conservative | Edward Kelson | 359 | 16.7 | +5.7 | |
| Majority | 962 | 44.8 | +32.9 | ||
| Turnout | 2,147 | 31.9 | −9.8 | ||
| Labour hold | Swing | ||||
Davyhulme East
| Party | Candidate | Votes | % | ±% | |
|---|---|---|---|---|---|
| Conservative | Michael Cornes* | 1,726 | 63.1 | −2.5 | |
| Labour | Nigel Roberts | 1,008 | 36.9 | +9.7 | |
| Majority | 718 | 26.2 | −6.2 | ||
| Turnout | 2,734 | 36.5 | −9.1 | ||
| Conservative hold | Swing | ||||
Davyhulme West
| Party | Candidate | Votes | % | ±% | |
|---|---|---|---|---|---|
| Conservative | June Reilly* | 1,735 | 61.4 | −1.0 | |
| Labour | Kevin Procter | 801 | 28.3 | −3.2 | |
| Green | Margaret Westbrook | 292 | 10.3 | +10.3 | |
| Majority | 934 | 33.1 | +4.3 | ||
| Turnout | 2,828 | 38.7 | −9.8 | ||
| Conservative hold | Swing | ||||
Flixton
| Party | Candidate | Votes | % | ±% | |
|---|---|---|---|---|---|
| Conservative | Elsie Ward* | 1,644 | 53.4 | −3.7 | |
| Labour | Joyce Acton | 1,030 | 33.4 | −1.4 | |
| Green | Christopher Webb | 406 | 13.2 | +13.2 | |
| Majority | 614 | 20.0 | +0.4 | ||
| Turnout | 3,080 | 38.4 | −10.2 | ||
| Conservative hold | Swing | ||||
Gorse Hill
| Party | Candidate | Votes | % | ±% | |
|---|---|---|---|---|---|
| Labour | David Acton* | 1,112 | 55.5 | −3.4 | |
| Conservative | George Manley | 496 | 24.8 | −7.1 | |
| Green | Philip Leape | 238 | 11.9 | +11.9 | |
| Independent | Colin Hendrie | 156 | 7.8 | +7.8 | |
| Majority | 616 | 30.7 | +8.6 | ||
| Turnout | 2,002 | 27.3 | −5.5 | ||
| Labour hold | Swing | ||||
Hale Barns
| Party | Candidate | Votes | % | ±% | |
|---|---|---|---|---|---|
| Conservative | Dilriaz Butt* | 2,061 | 71.1 | −9.8 | |
| Liberal Democrats | Richard Elliott | 538 | 18.6 | −0.5 | |
| Labour | Moira Lythgoe | 301 | 10.4 | +10.4 | |
| Majority | 1,523 | 52.5 | +39.7 | ||
| Turnout | 2,900 | 39.2 | −14.6 | ||
| Conservative hold | Swing | ||||
Hale Central
| Party | Candidate | Votes | % | ±% | |
|---|---|---|---|---|---|
| Conservative | Alan Mitchell* | 1,641 | 61.0 | −14.5 | |
| Liberal Democrats | Michael Mills | 418 | 15.5 | +2.3 | |
| Labour | Beverly Harrison | 335 | 12.5 | +1.3 | |
| Green | Samuel Little | 295 | 11.0 | +11.0 | |
| Majority | 1,223 | 45.5 | +12.3 | ||
| Turnout | 2,689 | 38.6 | −13.0 | ||
| Conservative hold | Swing | ||||
Longford
| Party | Candidate | Votes | % | ±% | |
|---|---|---|---|---|---|
| Labour | David Jarman* | 1,299 | 48.0 | +6.2 | |
| Conservative | Roderick Allan | 870 | 32.2 | +3.9 | |
| Green | Matthew Westbrook | 388 | 14.3 | +3.8 | |
| UKIP | Michael McManus | 148 | 5.5 | +5.5 | |
| Majority | 429 | 15.8 | +3.2 | ||
| Turnout | 2,705 | 33.6 | −6.5 | ||
| Labour hold | Swing | ||||
Priory
| Party | Candidate | Votes | % | ±% | |
|---|---|---|---|---|---|
| Labour | Jane Baugh* | 1,121 | 39.2 | −1.2 | |
| Conservative | Marion Rigby | 950 | 33.2 | +1.5 | |
| Liberal Democrats | Margaret Clarke | 510 | 17.8 | −7.9 | |
| Green | Joseph Westbrook | 281 | 9.8 | +9.8 | |
| Majority | 171 | 6.0 | +2.6 | ||
| Turnout | 2,862 | 39.3 | −12.1 | ||
| Labour hold | Swing | ||||
Sale Moor
| Party | Candidate | Votes | % | ±% | |
|---|---|---|---|---|---|
| Conservative | Christine Bailey* | 1,076 | 40.0 | +1.5 | |
| Labour | Stephen Smith | 1,051 | 39.1 | −0.3 | |
| Liberal Democrats | James Eisen | 562 | 20.9 | −1.8 | |
| Majority | 25 | 0.9 | −1.0 | ||
| Turnout | 2,689 | 36.6 | −7.8 | ||
| Conservative hold | Swing | ||||
St. Mary's
| Party | Candidate | Votes | % | ±% | |
|---|---|---|---|---|---|
| Conservative | John Tolhurst* | 1,555 | 52.2 | −4.9 | |
| Labour | Tom Ross | 833 | 28.0 | −5.3 | |
| Liberal Democrats | Diane Hibberd | 392 | 13.2 | +6.7 | |
| Green | Janet Jackson | 199 | 6.7 | +6.7 | |
| Majority | 722 | 24.2 | +8.4 | ||
| Turnout | 2,979 | 36.8 | −10.4 | ||
| Conservative hold | Swing | ||||
Stretford
| Party | Candidate | Votes | % | ±% | |
|---|---|---|---|---|---|
| Labour | Karina Carter* | 1,355 | 49.7 | −2.2 | |
| Conservative | Colin Hooley | 926 | 34.0 | −7.5 | |
| Green | Jennie Gander | 445 | 16.3 | +16.3 | |
| Majority | 429 | 15.7 | +12.6 | ||
| Turnout | 2,726 | 37.0 | −0.1 | ||
| Labour hold | Swing | ||||
Timperley
| Party | Candidate | Votes | % | ±% | |
|---|---|---|---|---|---|
| Liberal Democrats | Neil Taylor | 1,610 | 43.6 | +10.0 | |
| Conservative | Mohibul Choudhury | 1,508 | 40.9 | −17.4 | |
| Labour | Penelope Fraser | 389 | 10.5 | +2.3 | |
| Green | Martin Green | 184 | 5.0 | +5.0 | |
| Majority | 102 | 2.7 | −16.9 | ||
| Turnout | 3,691 | 44.8 | −7.6 | ||
| Liberal Democrats gain from Conservative | Swing | ||||
Urmston
| Party | Candidate | Votes | % | ±% | |
|---|---|---|---|---|---|
| Conservative | James Wibberley* | 1,507 | 46.4 | −3.6 | |
| Labour | William Clarke | 1,299 | 40.0 | −2.9 | |
| Green | Helen Jocys | 442 | 13.6 | +6.6 | |
| Majority | 208 | 6.4 | +3.2 | ||
| Turnout | 3,248 | 42.4 | −8.5 | ||
| Conservative hold | Swing | ||||
Village
| Party | Candidate | Votes | % | ±% | |
|---|---|---|---|---|---|
| Liberal Democrats | Douglas Fishwick* | 1,390 | 49.3 | −9.0 | |
| Conservative | Peter Cameron | 962 | 34.1 | −0.9 | |
| Labour | Stephanie Crean | 326 | 11.6 | +4.8 | |
| Green | Erica Wright | 142 | 5.0 | +5.0 | |
| Majority | 428 | 15.2 | −0.8 | ||
| Turnout | 2,820 | 38.2 | −8.9 | ||
| Liberal Democrats hold | Swing | ||||
References
- Details Official Trafford Council Election page
- v
- t
- e
Council elections in Greater Manchester
- 1838
- 1839
- 1840
- 1841
- 1842
- 1843
- 1844
- 1845
- 1846
- 1847
- 1848
- 1849
- 1850
- 1851
- 1852
- 1853
- 1854
- 1855
- 1856
- 1857
- 1858
- 1859
- 1860
- 1861
- 1862
- 1863
- 1864
- 1865
- 1866
- 1867
- 1868
- 1869
- 1870
- 1871
- 1872
- 1873
- 1874
- 1875
- 1876
- 1877
- 1878
- 1879
- 1880
- 1881
- 1882
- 1883
- 1884
- 1885
- 1886
- 1887
- 1888
- 1889
- 1890
- 1891
- 1892
- 1893
- 1894
- 1895
- 1896
- 1897
- 1898
- 1899
- 1900
- 1901
- 1902
- 1903
- 1904
- 1905
- 1906
- 1907
- 1908
- 1909
- 1910
- 1911
- 1912
- 1913
- 1914
- 1919
- 1920
- 1921
- 1922
- 1923
- 1924
- 1925
- 1926
- 1927
- 1928
- 1929
- 1930
- 1931
- 1932
- 1933
- 1934
- 1935
- 1936
- 1937
- 1938
- 1945
- 1946
- 1947
- 1949
- 1950
- 1951
- 1952
- 1953
- 1954
- 1955
- 1956
- 1957
- 1958
- 1959
- 1960
- 1961
- 1962
- 1963
- 1964
- 1965
- 1966
- 1967
- 1968
- 1969
- 1970
- 1971
- 1972
- 1973
- 1975
- 1976
- 1978
- 1979
- 1980
- 1982
- 1983
- 1984
- 1986
- 1987
- 1988
- 1990
- 1991
- 1992
- 1994
- 1995
- 1996
- 1998
- 1999
- 2000
- 2002
- 2003
- 2004
- 2006
- 2007
- 2008
- 2010
- 2011
- 2012
- 2014
- 2015
- 2016
- 2018
- 2019
- 2021
- 2022
- 2023
- 2024
- 2026
- See also: Wards
- Boundary changes


