2018 local election in England, UK
2018 Wigan Metropolitan Borough Council election
|
|
25 of 75 seats to Wigan Metropolitan Borough Council
38 seats needed for a majority |
|---|
| | First party | Second party | | | | | | Leader | Peter Smith | Michael Winstanley | | Party | Labour | Conservative | | Leader since | 1991 | 11 May 2016 | | Leader's seat | Leigh West | Orrell | | Seats before | 65 | 5 | | Seats won | 60 | 7 | | Seat change |  5 5 |  2 2 | |
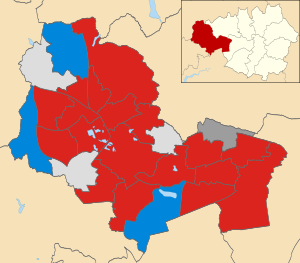 2018 local election results in Wigan Conservative Labour Independent Network Independent |
The 2018 Wigan Metropolitan Borough Council election took place on 3 May 2018 to elect members of Wigan Metropolitan Borough Council in England.[1] This was on the same day as other local elections.
Overview
Prior to the election, the composition of the council was:
- Labour Party: 65
- Conservative Party: 5
- Independents: 3
- Wigan Independents: 2
After the election, the composition of the council was:
- Labour Party: 60
- Conservative Party: 7
- Independents: 6
- Wigan Independents: 2
Number of Candidates fielded per party | Party | Number of Candidates |
| Labour Party (UK) | 25 |
| Conservative Party (UK) | 25 |
| Liberal Democrats (UK) | 14 |
| Independents | 11 |
| UKIP | 6 |
| Green Party of England and Wales | 3 |
| Wigan Independents | 3 |
| Democrats and Veterans | 1 |
Results summary
| 2018 Wigan Metropolitan Borough Council election |
| Party | This election | Full council | This election |
| Seats | Net | Seats % | Other | Total | Total % | Votes | Votes % | +/− |
| | Labour | 18 | 5 | 72 | 42 | 60 | 80 | 32,512 | 52.3 | 1.2 |
| | Conservative | 3 | 2 | 12 | 4 | 7 | 9.3 | 14,980 | 24.1 | 7.5 |
| | Independent | 3 | 3 | 12 | 3 | 6 | 8 | 8,432 | 13.6 | 6.2 |
| | Wigan Independents | 1 |  | 4 | 1 | 2 | 2.7 | 2,109 | 3.4 | 0.1 |
| | Liberal Democrats | 0 | | 0 | 0 | 0 | 0 | 2,343 | 3.8 | 2.8 |
| | UKIP | 0 | | 0 | 0 | 0 | 0 | 1,196 | 1.9 | 14.1 |
| | Green | 0 | | 0 | 0 | 0 | 0 | 401 | 0.6 | 0.2 |
| | Democrats and Veterans | 0 | | 0 | 0 | 0 | 0 | 140 | 0.2 | New |
Results
Bolton West constituency
Atherton ward
Local Elections 2018: Atherton | Party | Candidate | Votes | % | ±% |
| | Independent | Stuart Andrew Gerrard | 1,779 | 53.7 | New |
| | Labour | Karen Aldred | 1,197 | 36.2 | 11.9 |
| | Conservative | Marjorie Clayton | 334 | 10.1 | 2.0 |
| Majority | 582 | 17.5 | N/A |
| Turnout | 3,310 | 30.7 | 3.2 |
| | Independent gain from Labour | Swing | | |
Leigh constituency
Astley Mosley Common ward
Local Elections 2018: Astley Mosley Common | Party | Candidate | Votes | % | ±% |
| | Labour | Barry John Taylor | 1,349 | 52.7 | 14.9 |
| | Conservative | Richard Alan Short | 1,082 | 42.2 | 9.8 |
| | Liberal Democrats | Stuart David Thomas | 131 | 5.1 | New |
| Majority | 267 | 10.5 | 24.7 |
| Turnout | 2,562 | 27.2 | 1.7 |
| | Labour hold | Swing | | |
Atherleigh ward
Local Elections 2018: Atherleigh | Party | Candidate | Votes | % | ±% |
| | Labour | Debra Susan Ann Wailes | 938 | 48.1 | 1.4 |
| | Independent | Anthony Thomas Waite | 550 | 28.2 | New |
| | Conservative | Paul Lambert Fairhurst | 394 | 20.2 | 5.6 |
| | Liberal Democrats | Lorraine Gillon | 68 | 3.5 | New |
| Majority | 388 | 19.9 | 2.6 |
| Turnout | 1,950 | 23.4 | 3.3 |
| | Labour hold | Swing | | |
Golborne and Lowton West ward
Local Elections 2018: Golborne and Lowton West | Party | Candidate | Votes | % | ±% |
| | Labour | Susan Gambles | 1,280 | 57.2 | 7.8 |
| | Independent | William Kenneth Heaton | 612 | 27.4 | New |
| | Conservative | Gerard Joseph Houlton | 345 | 15.4 | 1.0 |
| Majority | 668 | 29.8 | 16.6 |
| Turnout | 2,237 | 25.3 | 1.7 |
| | Labour hold | Swing | | |
Leigh East ward
Local Elections 2018: Leigh East | Party | Candidate | Votes | % | ±% |
| | Labour | Frederick Brown Walker | 1,189 | 59.6 | 11.3 |
| | Conservative | Denise Alison Young | 518 | 26.0 | 3.1 |
| | Liberal Democrats | John Dowsett | 288 | 14.4 | New |
| Majority | 671 | 33.6 | 8.2 |
| Turnout | 1,995 | 22.2 | 2.7 |
| | Labour hold | Swing | | |
Leigh South ward
Local Elections 2018: Leigh South | Party | Candidate | Votes | % | ±% |
| | Labour | Charles Rigby | 1,531 | 54.4 | 11.1 |
| | Conservative | Connor Jack Short | 1,283 | 45.6 | 11.1 |
| Majority | 248 | 8.8 | 22.2 |
| Turnout | 2,814 | 27.5 | 1.1 |
| | Labour hold | Swing | | |
Leigh West ward
Local Elections 2018: Leigh West | Party | Candidate | Votes | % | ±% |
| | Labour | Peter Richard Charles Smith | 1,308 | 54.1 | 21.2 |
| | Independent | Jayson Michael Allan Lomax-Hargreaves | 578 | 23.9 | New |
| | Conservative | Richard Byrom Houlton | 374 | 15.5 | 9.2 |
| | Liberal Democrats | Natalie Smalley | 158 | 6.5 | New |
| Majority | 730 | 30.2 | 20.4 |
| Turnout | 2,418 | 23.1 | 1.8 |
| | Labour hold | Swing | | |
Lowton East ward
Local Elections 2018: Lowton East | Party | Candidate | Votes | % | ±% |
| | Conservative | Edward Noel Houlton | 2,099 | 60.9 | 14.7 |
| | Labour | Garry Peter Lloyd | 1,346 | 39.1 | 6.4 |
| Majority | 753 | 21.8 | 8.3 |
| Turnout | 3,445 | 36.1 | 1.0 |
| | Conservative hold | Swing | | |
Tyldesley ward
Local Elections 2018: Tyldesley | Party | Candidate | Votes | % | ±% |
| | Labour | Joanne Marshall | 1,344 | 51.0 | 14.6 |
| | Independent | Julian David Marsh | 706 | 26.8 | New |
| | Conservative | David John Stirzaker | 587 | 22.3 | 2.5 |
| Majority | 638 | 24.2 | 21.6 |
| Turnout | 2,637 | 25.5 | 0.9 |
| | Labour hold | Swing | | |
Makerfield constituency
Abram ward
Local Elections 2018: Abram | Party | Candidate | Votes | % | ±% |
| | Labour | Carl Sweeney | 1,479 | 68.7 | 11.3 |
| | Conservative | Beverley Anne Bridgwater | 404 | 18.8 | 12.3 |
| | UKIP | Frank Thomas Swift | 274 | 12.7 | 14.9 |
| Majority | 1,075 | 49.9 | 20.1 |
| Turnout | 2,152 | 20.7 | 4.0 |
| | Labour hold | Swing | | |
Ashton ward
Local Elections 2018: Ashton | Party | Candidate | Votes | % | ±% |
| | Labour | Anthony John Sykes | 1,112 | 53.2 | 10.9 |
| | Independent | Michael Moulding | 793 | 37.9 | New |
| | UKIP | Gillian Mary Gibson | 109 | 5.2 | 16.7 |
| | Liberal Democrats | Geoffrey Stephen Matthews | 41 | 2.0 | New |
| | Conservative | Marie Winstanley | 36 | 1.7 | 4.6 |
| Majority | 319 | 15.3 | 5.1 |
| Turnout | 2,091 | 23.5 | 6.1 |
| | Labour hold | Swing | | |
Bryn ward
Local Elections 2018: Bryn | Party | Candidate | Votes | % | ±% |
| | Independent | Andrew Collinson | 1,065 | 43.7 | New |
| | Labour | Vicky Johnson | 973 | 39.9 | 0.3 |
| | Conservative | Judith Anderson | 198 | 8.1 | 3.7 |
| | UKIP | Philip Hayden | 133 | 5.5 | 19.0 |
| | Liberal Democrats | Denise Melling | 67 | 2.8 | 7.0 |
| Majority | 92 | 3.8 | N/A |
| Turnout | 2,436 | 27.6 | 4.2 |
| | Independent gain from Labour | Swing | | |
Hindley ward
Local Elections 2018: Hindley | Party | Candidate | Votes | % | ±% |
| | Labour | Jim Talbot | 1,063 | 45.9 | 7.2 |
| | Independent | Jim Ellis | 905 | 39.0 | New |
| | Conservative | Margaret Mary Winstanley | 206 | 8.9 | 0.9 |
| | Green | Neil Hancox | 86 | 3.7 | New |
| | Liberal Democrats | John Charles Skipworth | 58 | 2.5 | New |
| Majority | 158 | 6.9 | 12.0 |
| Turnout | 2,318 | 24.1 | 2.3 |
| | Labour hold | Swing | | |
Hindley Green ward
Local Elections 2018: Hindley Green | Party | Candidate | Votes | % | ±% |
| | Independent | Paul Anthony Maiden | 976 | 41.4 | New |
| | Labour | Gena Merrett | 787 | 33.4 | 10.5 |
| | Liberal Democrats | John Thomason | 305 | 13.0 | New |
| | Conservative | Jonathan Charles Cartwright | 287 | 12.2 | 3.1 |
| Majority | 189 | 8.0 | N/A |
| Turnout | 2,355 | 27.4 | 2.3 |
| | Independent gain from Labour | Swing | | |
Orrell ward
Local Elections 2018: Orrell | Party | Candidate | Votes | % | ±% |
| | Conservative | Richard Clayton | 1,430 | 46.6 | 14.0 |
| | Labour | Eileen Winifred Rigby | 1,273 | 41.5 | 6.6 |
| | Liberal Democrats | Denise Margaret Capstick | 367 | 12.0 | New |
| Majority | 157 | 5.1 | N/A |
| Turnout | 3,070 | 32.2 | 1.0 |
| | Conservative gain from Labour | Swing | | |
Winstanley ward
Local Elections 2018: Winstanley | Party | Candidate | Votes | % | ±% |
| | Labour | Clive William Morgan | 1,396 | 58.4 | 14.3 |
| | Conservative | Daniel Andrew Whitehouse | 509 | 21.3 | 11.5 |
| | Green | Steven Charles Heyes | 195 | 8.2 | 0.4 |
| | UKIP | Daniel John Singleton | 177 | 7.4 | 25.3 |
| | Liberal Democrats | Neil Duncan Stevenson | 114 | 4.8 | New |
| Majority | 887 | 37.1 | 25.7 |
| Turnout | 2,391 | 26.2 | 3.2 |
| | Labour hold | Swing | | |
Worsley Mesnes ward
Local Elections 2018: Worsley Mesnes | Party | Candidate | Votes | % | ±% |
| | Labour | Patricia Lynne Holland | 1,449 | 66.5 | 6.1 |
| | UKIP | Maureen McCoy | 327 | 15.0 | 16.7 |
| | Conservative | Paul Chapman | 314 | 14.4 | 6.5 |
| | Liberal Democrats | Joshua Hindle | 90 | 4.1 | New |
| Majority | 1122 | 51.5 | 22.8 |
| Turnout | 2,180 | 24.1 | 4.1 |
| | Labour hold | Swing | | |
Wigan constituency
Aspull, New Springs and Whelley ward
Local Elections 2018: Aspull, New Springs and Whelley | Party | Candidate | Votes | % | ±% |
| | Labour | Ronald Josef Conway | 1,708 | 61.4 | 15.4 |
| | Conservative | Michael Colin Owens | 764 | 27.5 | 16.1 |
| | Liberal Democrats | Andrew Julian Lee Holland | 308 | 11.1 | New |
| Majority | 944 | 33.9 | 12.0 |
| Turnout | 2,780 | 28.2 | 5.0 |
| | Labour hold | Swing | | |
Douglas ward
Local Elections 2018: Douglas | Party | Candidate | Votes | % | ±% |
| | Labour | Shirley Ann Dewhurst | 1,551 | 78.6 | 18.6 |
| | Conservative | Margaret Atherton | 422 | 21.4 | 13.0 |
| Majority | 1,129 | 57.2 | 28.7 |
| Turnout | 1,973 | 20.8 | 4.1 |
| | Labour hold | Swing | | |
Ince ward
Local Elections 2018: Ince | Party | Candidate | Votes | % | ±% |
| | Labour | James Moodie | 1,273 | 69.2 | 12.4 |
| | Independent | James O'Neill | 379 | 20.6 | New |
| | Conservative | Yamini Gupta | 188 | 10.2 | 4.8 |
| Majority | 894 | 48.6 | 26.4 |
| Turnout | 1,840 | 20.7 | 5.4 |
| | Labour hold | Swing | | |
Pemberton ward
Local Elections 2018: Pemberton | Party | Candidate | Votes | % | ±% |
| | Labour | Paul Prescott | 1,472 | 74.4 | 11.7 |
| | Conservative | Susan Atherton | 322 | 16.3 | 8.8 |
| | Liberal Democrats | David John Burley | 185 | 9.3 | New |
| Majority | 1,150 | 58.1 | 22.0 |
| Turnout | 1,979 | 20.6 | 4.8 |
| | Labour hold | Swing | | |
Shevington with Lower Ground ward
Local Elections 2018: Shevington with Lower Ground | Party | Candidate | Votes | % | ±% |
| | Shevington Independents | Janet Brown | 1,107 | 40.1 | 14.8 |
| | Labour | Mike Crosby | 1,045 | 37.9 | 4.6 |
| | Conservative | Allan Atherton | 487 | 17.7 | 6.5 |
| | Green | Joseph Robert Rylance | 120 | 4.3 | 0.6 |
| Majority | 62 | 2.2 | N/A |
| Turnout | 2,759 | 29.6 | 3.9 |
| | Shevington Independents gain from Labour | Swing | | |
"Shevington Independents" is a description used by candidates for the Wigan Independents.
Standish with Langtree ward
Local Elections 2018: Standish with Langtree | Party | Candidate | Votes | % | ±% |
| | Conservative | Adam James Marsh | 1,200 | 36.8 | 17.4 |
| | Labour | Debbie Parkinson | 1,185 | 36.4 | 18.5 |
| | Standish Independents | Debbie Fairhurst | 872 | 26.8 | 15.8 |
| Majority | 15 | 0.4 | N/A |
| Turnout | 3,257 | 33.3 | 3.4 |
| | Conservative gain from Standish Independents | Swing | | |
"Standish Independents" is a description used by candidates for the Wigan Independents.
Wigan Central ward
Local Elections 2018: Wigan Central | Party | Candidate | Votes | % | ±% |
| | Labour | George Davies | 1,518 | 55.5 | 3.7 |
| | Conservative | Lewis David Evans | 834 | 30.5 | 10.9 |
| | Liberal Democrats | Caroline Waddicor | 163 | 6.0 | New |
| | Wigan Independents | Gareth William Fairhurst | 130 | 4.8 | New |
| | Independent | Tony Spencer | 89 | 3.3 | New |
| Majority | 684 | 25.0 | 1.8 |
| Turnout | 2,734 | 29.5 | 3.7 |
| | Labour hold | Swing | | |
Wigan West ward
Local Elections 2018: Wigan West | Party | Candidate | Votes | % | ±% |
| | Labour | Phyllis Mary Cullen | 1,746 | 72.0 | 11.4 |
| | Conservative | Jean Margaret Peet | 363 | 15.0 | 9.6 |
| | UKIP | Nathan Alan Ryding | 176 | 7.3 | 17.9 |
| | Democrats and Veterans | Ronnie Clark | 140 | 5.8 | New |
| Majority | 1,383 | 57.0 | 21.6 |
| Turnout | 2,425 | 25.4 | 2.7 |
| | Labour hold | Swing | | |
References
External links


 5
5  1.2
1.2 


